What Are the 2026 Top Recycled Materials for Global Buyers?

In 2026, global buyers will judge recycled materials by more than price. Availability, consistent quality, traceability, and verified environmental performance will shape purchasing decisions. Recycled aluminum, steel, PET, HDPE, paper, cardboard, glass, and textile fibers are likely to remain central choices. Yet “top” does not mean identical everywhere. Regional collection systems, processing capacity, contamination levels, and transport costs can change the best option quickly.

William McDonough, a leading circular-economy thinker and co-author of Cradle to Cradle, expressed the core principle simply: “Waste equals food.” His statement remains practical for procurement teams. A used beverage bottle can become food-grade packaging material, but only when sorting, washing, testing, and certification are properly controlled. A damaged metal batch tells a different story. It may require extra processing, increasing both cost and emissions.

Details matter.

This guide examines which recycled materials may offer the strongest value for international buyers in 2026. It considers recycled content, supply reliability, contamination risk, performance, and documentation. Buyers should check recognized certifications, chain-of-custody records, laboratory reports, and supplier audits before signing contracts. Standards can vary between markets. Claims can also be overstated.

There is room for doubt.

Some materials may appear sustainable while traveling long distances or relying on unstable collection networks. Others may perform well but lack sufficient volume. The most responsible choice will depend on the application, location, and evidence available. This article provides a practical framework, not a universal ranking, for making more informed recycled materials decisions.
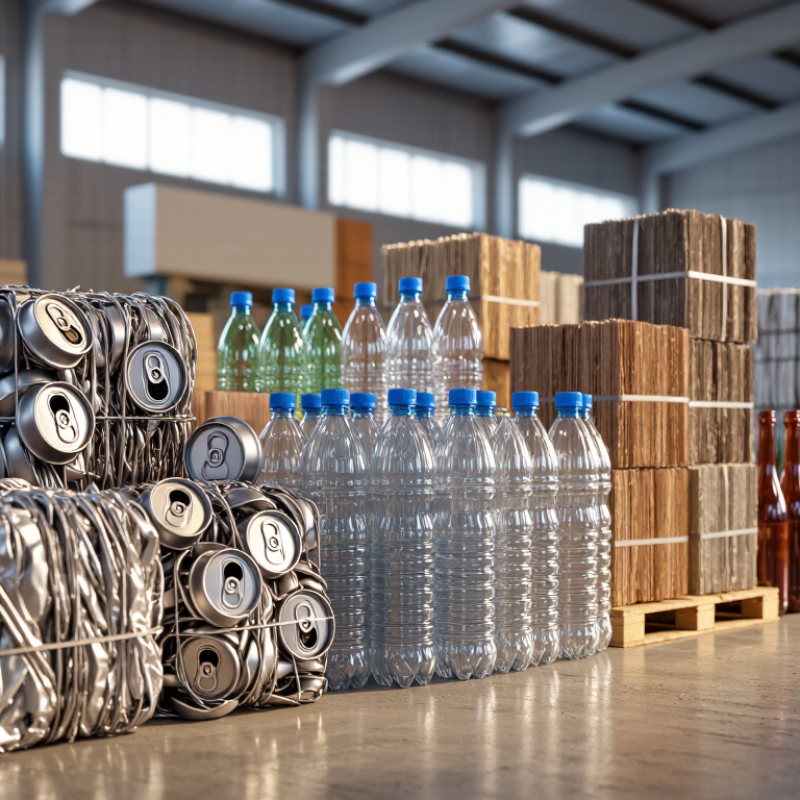
What Are the 2026 Top Recycled Materials for Global Buyers?

Set 2026 Buying Criteria Against the Global Plastics Recycling Rate of 9%

What Are the 2026 Top Recycled Materials for Global Buyers?

Set 2026 Buying Criteria Against the Global Plastics Recycling Rate of 9%

The OECD Global Plastics Outlook reports that only 9% of global plastic waste was recycled in 2019. This figure should shape every 2026 sourcing decision. Recycled PET, HDPE, and PP remain practical choices because collection and processing systems already exist in many markets. However, supply is uneven. A lower quoted price may hide higher contamination, unstable color, or poor melt performance.

The United Nations Environment Programme estimates that over 430 million tonnes of plastic are produced annually. Much of it becomes short-lived packaging. Buyers should therefore assess recycled content, processing method, origin, and batch consistency. Mechanical recycling often offers clearer physical traceability. Chemical recycling may expand feedstock options, but its energy use and verification require careful review. The industry still has gaps. That matters.

Tips: Request independent test reports for melt flow, moisture, ash, and contamination. Check whether recycled claims refer to pre-consumer or post-consumer material. Compare usable yield, not only the price per tonne. Ask suppliers how they handle rejected loads and seasonal shortages.

Recycled aluminum and recycled paper can also support lower-impact purchasing, especially where recovery rates are stronger. Yet “recycled” does not automatically mean responsible. The Ellen MacArthur Foundation has repeatedly emphasized the need for circular design and reliable collection systems. In 2026, serious buyers should accept imperfect data, document its limits, and update supplier scores when evidence changes.

Compare Recycled Steel and Aluminum, Saving Up to 95% Energy

For global buyers in 2026, recycled steel and aluminum offer clear energy advantages. The International Aluminium Institute reports that recycled aluminum requires about 95% less energy than primary aluminum. This difference is substantial. A used beverage can can return to production with far less melting energy than bauxite processing and refining.

Steel also performs strongly. The World Steel Association reports that recycling steel through electric furnaces can reduce energy use by roughly 60–74% compared with primary production routes. Actual savings depend on scrap quality, furnace efficiency, electricity sources, and transport distance. Buyers should request batch-level data, not broad environmental claims. Scrap contamination can increase processing losses. It can also weaken final material performance.

Cost matters, but energy data needs context. Recycled aluminum may carry a higher price when clean, certified scrap is scarce. Recycled steel can be more stable in markets with strong collection systems. The International Energy Agency and the United Nations Environment Programme both emphasize material efficiency and recycling as important pathways for reducing industrial emissions. Still, recycled content alone does not prove low impact. A distant shipment powered by carbon-intensive electricity may reduce the benefit. This is easy to overlook. Procurement teams should compare recycled content, product quality, verified emissions, transport, and traceability together. Some reporting remains incomplete. That deserves careful questioning.

Assess Recycled Paper and Cardboard Through Europe’s 79.3% Recovery Rate

Europe’s 79.3% paper recovery rate signals strong demand for recycled paper and cardboard among global buyers. The European Paper Recycling Council reported this rate in its industry monitoring data. It reflects collection, sorting, and reprocessing across European markets.

The material is practical. Recycled corrugated board can protect appliances, spare parts, and packaged food during transport. Buyers should inspect fiber strength, moisture resistance, and contamination levels before contracting suppliers. A clean bale tells only part of the story. Testing compression performance is essential.

Eurostat’s packaging data also places paper and cardboard among Europe’s most recycled packaging materials. This supports their role in procurement strategies focused on lower material waste. However, recovery rates do not guarantee identical quality everywhere. Collection systems differ. Recycled fibers also shorten after repeated processing, which can reduce strength.

Small details matter. Ask for moisture results, bale composition, and recent laboratory records. Request chain-of-custody evidence when origin matters. Industry specifications should define acceptable ink, adhesive, and plastic residue levels. Buyers may also compare recycled content with required performance, rather than choosing the highest percentage automatically.

The market is not perfectly uniform. Some shipments may meet sustainability targets but fail during humid storage. That gap deserves more attention. A realistic purchasing decision balances recovery data, fiber quality, delivery reliability, and verified processing controls.

What Are the 2026 Top Recycled Materials for Global Buyers? — Assess Recycled Paper and Cardboard Through Europe’s 79.3% Recovery Rate
Rank Recycled Material Typical Recycled Feedstock Common Buyer Applications Key Quality or Compliance Metric Global Buyer Advantages Main Purchasing Risks 2026 Buyer Priority
1 Recycled Paper Recovered newspapers, office paper, magazines, and mixed paper collected through municipal or commercial systems. Printing papers, envelopes, tissues, notebooks, wrapping paper, and molded-fiber products. Europe’s referenced recovery benchmark: 79.3%. Buyers should additionally verify recycled content, brightness, moisture, ash, and contaminants. Established collection infrastructure, broad availability, lower reliance on virgin fiber, and strong demand for recycled-content packaging and stationery. Mixed grades can contain adhesives, plastics, inks, or moisture. Quality can vary significantly by collection region and sorting process. Very High
2 Recycled Cardboard Used corrugated boxes, kraft cartons, paperboard packaging, and post-industrial board trimmings. Shipping boxes, retail cartons, mailers, dividers, protective packaging, and paper-based displays. Important specifications include grammage, burst or edge-crush performance, moisture, recycled-fiber percentage, and allowable contaminants. High-volume feedstock, efficient processing, strong suitability for e-commerce packaging, and easy integration into existing packaging lines. Repeated recycling shortens fiber length, which can reduce strength. Wet or oil-contaminated cartons may be unsuitable for high-grade applications. Very High
3 Recycled Aluminum Used beverage cans, industrial scrap, fabrication offcuts, and end-of-life aluminum products. Beverage cans, food containers, automotive parts, construction products, and consumer goods. Aluminum can be recycled repeatedly without losing its basic material properties. Buyers should check alloy composition, oil, paint, and non-aluminum attachments. High material value, permanent recyclability, significant energy savings compared with primary aluminum, and strong international scrap demand. Prices are sensitive to energy costs and commodity markets. Mixed alloys may require additional sorting or remelting controls. Very High
4 Recycled Glass Color-sorted post-consumer glass containers and factory glass cullet. Bottles, jars, fiberglass, glass insulation, tiles, and construction aggregates. Color, particle size, ceramic content, stones, metals, and organic contamination are major quality controls. Can be recycled repeatedly, reduces demand for virgin mineral raw materials, and is suitable for closed-loop container production when properly sorted. High transport weight, breakage, and color-mixing problems can raise logistics and processing costs. High
5 Recycled Steel End-of-life vehicles, construction scrap, appliances, manufacturing offcuts, and used steel packaging. Construction beams, machinery, automotive components, appliances, cans, and structural products. Scrap grade, residual copper, alloy content, radiation screening, and preparation size are critical purchasing parameters. Strong magnetic separation, mature scrap markets, high durability, and suitability for repeated use in steelmaking. Mixed scrap may contain copper, coatings, or hazardous residues. Freight costs can be significant because of weight. High
6 Recycled PET Used PET bottles, thermoform packaging, and post-industrial PET waste. New bottles, food and non-food packaging, polyester fibers, strapping, and sheets. Intrinsic viscosity, color, flake purity, moisture, odor, and food-contact authorization must be verified for sensitive applications. Widely collected packaging resin, established flake and pellet markets, and compatibility with recycled-content targets. Food-grade applications require strict decontamination and regulatory controls. Color and polymer-mix contamination can limit end uses. High
7 Recycled HDPE Used detergent bottles, containers, crates, pipes, and industrial HDPE scrap. Non-food bottles, pipes, pallets, bins, crates, drainage products, and household goods. Melt-flow rate, density, color, odor, contamination, and polymer identification are the principal technical checks. Good mechanical performance, relatively durable recycled pellets, and broad use in non-food packaging and industrial products. Color sorting and mixed-polymer contamination can restrict applications. Food-contact use requires additional regulatory qualification. Medium to High
8 Recycled Textiles Pre-consumer cutting waste, post-consumer garments, cotton-rich textiles, and polyester textile waste. Insulation, wiping cloths, nonwovens, yarn blends, padding, automotive interiors, and apparel fibers. Fiber composition, staple length, color, moisture, chemical residues, and blend separation determine the usable output. Diverts textile waste from disposal and supports demand for recycled fibers and lower-impact nonwoven materials. Blended fibers, elastane, dyes, finishes, and limited collection infrastructure can make high-quality recycling difficult. Medium to High
9 Recycled Wood Used pallets, construction wood, sawmill residues, and clean post-industrial wood waste. Particleboard, fiberboard, pallets, animal bedding, landscaping products, and biomass fuel. Moisture, particle size, wood species, preservatives, paint, and formaldehyde-related requirements must be assessed. Useful for engineered panels and industrial products, with established recovery channels in many markets. Treated or painted wood may contain hazardous substances and may not be suitable for all applications. Medium
Buyer note: The 79.3% figure is presented as the Europe recovery benchmark referenced in the title. Recovery is broader than recycling and may include collection, sorting, preparation, and recycling pathways; buyers should therefore confirm the exact methodology, reporting year, recycled-content percentage, chain of custody, and applicable product regulations before comparing suppliers or materials.

Rank E-Waste Materials Despite Only 22.3% Formal Recycling in 2022

What Are the 2026 Top Recycled Materials for Global Buyers?

Electronic waste remains one of the most valuable recycled material streams. Yet only 22.3% of global e-waste entered formal recycling channels in 2022. This gap creates both supply opportunities and serious verification challenges for international buyers.

Copper ranks highly because it appears in cables, motors, circuit boards, and power equipment. Aluminum follows closely, supported by strong demand and relatively efficient recovery. Ferrous metals offer large volumes, although their unit value is usually lower. Precious metals, including gold, silver, and palladium, occur in smaller quantities but can significantly increase material value. Recovered plastics and glass also matter, especially when sorting quality and contamination levels are documented.

The ranking is not perfect. It changes with metal prices, collection systems, and processing technology. A shipment labeled “high-grade boards” may contain mixed components, moisture, or unwanted residues. Buyers should request recent sampling records, weight-based composition data, and documented chain-of-custody procedures. Independent assays can confirm metal content before final pricing. Formal recycling status also deserves attention, because informal handling may weaken worker protection and environmental controls. Reliable suppliers should explain where materials originated, how they were processed, and which test methods support their claims. Small details matter. A precise scale, sealed sample, and dated inspection record can prevent costly misunderstandings.

Verify Material Quality with ISO 14021 Claims and Chain-of-Custody Data

What Are the 2026 Top Recycled Materials for Global Buyers?

Global buyers are evaluating recycled plastics, recycled metals, reclaimed textiles, and recovered paper more carefully. Material popularity means little without reliable evidence. ISO 14021 helps suppliers make clear, self-declared claims about recycled content. It also encourages precise wording, such as pre-consumer or post-consumer material. Vague phrases like “eco-friendly” create purchasing risks.

A strong review connects the claim with chain-of-custody data. Ask for supplier invoices, batch numbers, production dates, and processing records. Compare those records with test results for fiber content, polymer type, moisture, or metal composition. In real procurement reviews, small mismatches often reveal weak tracking. A certificate alone is not enough. It may confirm a system, but not every shipment. This is where buyers need patience and informed questions.

Tips: Request a sample before approval. Match the sample to its batch record. Check whether recycled content is calculated by mass. Confirm independent verification when volumes are large. Keep records for each shipment. Do not accept unclear percentages. One overlooked detail can affect the entire claim. Supplier data may also be incomplete, so leave room for correction and reassessment.